Grace and I finished our video yesterday! Check it out: https://twitter.com/grayy_seaa/status/724395473281277952
Month: April 2016
STD Video
Stress vs Homework video
All of our project is done and all that is left is to show our video.
So here it is!
Best Buddies Video
Here’s our commercial for our Best Buddies project!
-Isabella, Kiana, Megan
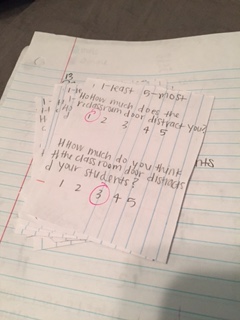
Classroom Door Distraction & Video
Update: Since collecting surveys from 14 teachers I collected enough data to look at how much the classroom door is distracting teachers. And furthermore more I asked teachers (in their own opinions) how they see the door affecting their students. This will help me to see if teachers think it’s more of a distraction to students, than students think it is a distraction to themselves.
The results of my surveys from teachers were: (1-least, 5-most)
| Q1: Distraction for teachers | Q2: teacher opinion about students | ||
| 1 | IIIIII | 1 | III |
| 2 | II | 2 | I |
| 3 | III | 3 | I |
| 4 | III | 4 | IIII |
| 5 | 5 | IIIII |
The sample mean level of distraction of teachers (Q1) is 2.21 while the sample mean score for teacher’s opinion about student level of distraction (Q2) is 3.5
Here is a confidence interval based on data from surveys from last quarter about student’s distraction levels.
Conditions: random classrooms were selected, 103 is less than 10% of all the students. Using T int
( formula as well – Statistic +/- (critical value) (Sx / √n) 2.37 +/- (1.771) (1.25 / √14) )
I am 90% confident that the true score of student’s distraction level at Edison high school falls between (2.18, 2.57) x̄= 2.38. Sx=2.38. n=103.
This range of (2.18, 2.57) is on the lower side of the scale 1-5, looking like majority of students are not as effected as I thought.
Next I am constructing a confidence interval to help find the true mean level distraction of teachers. At the 90%
Conditions: The teachers were randomly selected, 14 is greater than 10 % but the graph shows very slight skewness no outliers. Using T int
( formula as well – Statistic +/- (critical value) (Sx / √n) 2.39 +/- (1.666) (1.197 / √103) )
I am 90% confident that the true score of teacher’s distraction level at Edison high school falls between (1.622, 2.8066) x̄=2.21. Sx=1.25. n=14.
This is a wider range than the students responses but still on the lower end.
Here is my video:
Flipped Classroom Video
All of the work is done for the written portion of our project and we have just finished putting together our video. We hope that this commercial can successfully show what we are trying to prove in our project. Hope you guys like it!
Confidence in Freethrows Video (Pt 4)
Excited to finally share my video that I have made to endorse the difficulties in freethrows and how it serves as a problem towards basketball players and their teams!
Chocolate Milk Video!
Heres the link to our video endorsing our finding about chocolate milk and how it relates to swimmers weights and times. Enjoy!
Tilapia in Large Tank Vs. Small Tank Growth Rate Video
AP Stats: Graduation Video
We just finished our commercial on graduation and we are very excited to present what we found out!
